Goals for Student Achievement
The College's institutional goals for student achievement are determined relative to multiple sources of comparative data and to institutional aspirations, as stated in the College's strategic plan. The College uses multiple measures to document student success at both the undergraduate and graduate levels, consistent with its mission and its status as a doctoral/professional university under South Carolina Code of Laws Title 59, §59-103-15.
Because performance indicators for graduates' achievements are specified in South Carolina law, the College of Charleston relies primarily on comparisons to other universities also assigned by the state to its "four-year colleges and universities" category. Further, because the College has been characterized by stable undergraduate enrollments and SAT/ACT scores for incoming undergraduate students, the College's past performance is heavily weighted in determining appropriate criteria and thresholds of acceptability for undergraduate student achievement.
Goals for Measuring Student Achievement
-
Goal 1: Four-Year Graduation Rate
Goal 1: Four-Year Graduation Rate
Institutional Goal: For students enrolling as degree-seeking undergraduates, the College's strategic plan goal for the four-year graduation rate is 62%. This goal is intended to increase the four-year graduation rate, thereby improving student success outcomes and positioning the College among the very best institutions in the state, region, and nation.
The College of Charleston defines this measure as the percentage of first-time, full-time, degree-seeking freshmen graduating within four years of entry, using the Integrated Postsecondary Education Data System (IPEDS) graduation rate methodology.
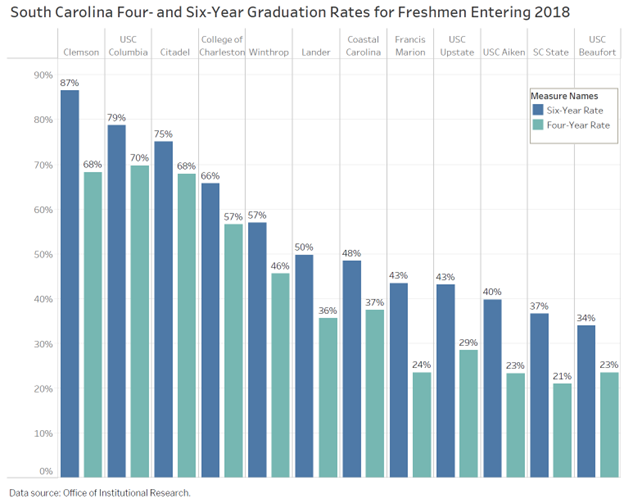
Outcome: The College is making positive progress toward the strategic plan goal for the four-year graduation rate. Over recent entering cohorts, the College's four-year graduation rate has ranged between 55.7% and 61.6% (Table 1). Based on the 2018 entering cohort, the College's four-year graduation rate of 57% places the institution fourth among the twelve South Carolina institutions in the four-year college and university category (Figure 2).
Table 1. Four-Year Graduation Rates and Cohort Sizes
Entering Cohort Term Cohort Size Four-Year Rate (Goal: 62%) 2010 2,007 58.0% 2011 2,330 55.9% 2012 2,134 61.6% 2013 2,110 56.8% 2014 2,161 56.8% 2015 2,229 58.5% 2016 2,342 56.7% 2017 1,838 56.0% 2018 2,197 56.6% 2019 2,046 55.7% 2020 2,040 58.3% 2021 2,464 59.7% Data source: Office of Institutional Research.
Figure 1. Freshmen Graduation Rates with corresponding incremental goals published on the Strategic Plan Key Metrics website.
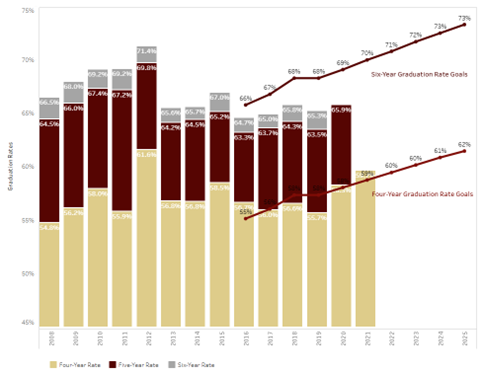
Figure 2. South Carolina Four-Year Graduation Rates for Freshmen Entering 2018.
Data source: Office of Institutional Research.
Disaggregated Outcomes for the 2018 Entering Cohort
For deeper analysis, Table 2 presents four-year graduation rates for the 2018 entering cohort disaggregated by sex, race/ethnicity, and aid received. The four-year graduation rate for all students in the cohort was 57%.
- By sex: Women achieved a four-year graduation rate of 61%, compared with 47% for men.
- By race/ethnicity: Among the larger subgroups, White students achieved a four-year rate of 58% (women 62%, men 49%); Hispanic/Latino students 59% (women 69%, men 37%); Black or African American students 49% (women 55%, men 35%); and Asian students 69% (women 71%, men 57%).
- By aid received: Pell Grant recipients achieved a four-year graduation rate of 51%. Stafford Loan (non-Pell) recipients achieved 53%. Students receiving neither form of aid achieved 60%.
Table 2. Four-Year Graduation Rates for Freshmen Cohort 2018 by Sex, Race/Ethnicity, and Aid Received.
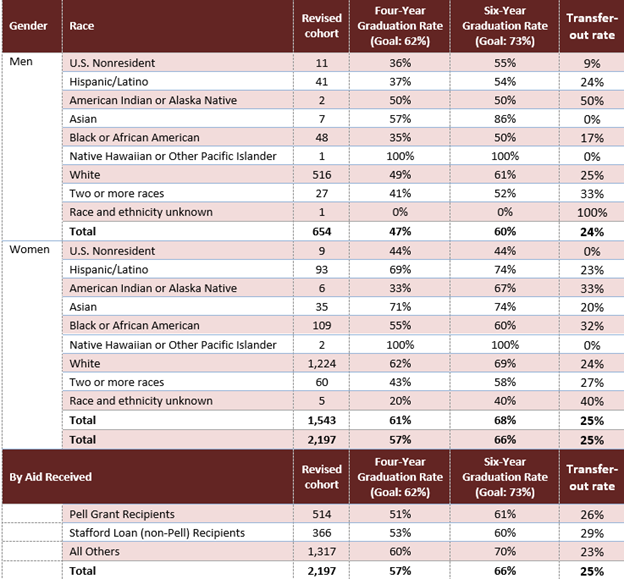
Note: 2018 represents Academic Year (AY) 2018–2019. Data source: 2024 IPEDS Graduation Rate Survey, provided by the Office of Institutional Research.
-
Goal 2: Six-Year Graduation Rate
Goal 2: Six-Year Graduation Rate
Institutional Goal: For students enrolling as degree-seeking undergraduates, the College's strategic plan goal for the six-year graduation rate is 73%. This goal is intended to increase the six-year graduation rate, thereby improving student success outcomes and positioning the College among the very best institutions in the state, region, and nation.
The College of Charleston defines this measure as the percentage of first-time, full-time, degree-seeking freshmen graduating within six years of entry, using the IPEDS graduation rate methodology.
Outcome: The College is making positive progress toward the strategic plan goal for the six-year graduation rate. Over recent entering cohorts, the College's six-year graduation rate has ranged between 64.7% and 71.4% (Table 1). Based on the 2018 entering cohort, the College's six-year graduation rate of 66% places the institution fourth among the twelve South Carolina institutions in the four-year college and university category (Figure 2).
Table 1. Six-Year Graduation Rates and Cohort Sizes
Entering Cohort Term Cohort Size Six-Year Rate (Goal: 73%) 2010 2,007 69.2% 2011 2,330 69.2% 2012 2,134 71.4% 2013 2,110 65.6% 2014 2,161 65.7% 2015 2,229 67.0% 2016 2,342 64.7% 2017 1,838 65.0% 2018 2,197 65.8% 2019 2,046 65.3% Note: Six-year graduation rates for the 2020 and 2021 entering cohorts are not yet available and will be updated once data are released. Data source: Office of Institutional Research.
Figure 1. Freshmen Graduation Rates with corresponding incremental goals published on the Strategic Plan Key Metrics website.
Figure 2. South Carolina Six-Year Graduation Rates for Freshmen Entering 2018.
Data source: Office of Institutional Research.
Disaggregated Outcomes for the 2018 Entering Cohort
For deeper analysis, Table 2 presents six-year graduation rates for the 2018 entering cohort disaggregated by sex, race/ethnicity, and aid received. The six-year graduation rate for all students in the cohort was 66%.
- By sex: Women achieved a six-year graduation rate of 68%, compared with 60% for men.
- By race/ethnicity: Among the larger subgroups, White students achieved a six-year rate of 67% (women 69%, men 61%); Hispanic/Latino students 68% (women 74%, men 54%); Black or African American students 57% (women 60%, men 50%); and Asian students 76% (women 74%, men 86%).
- By aid received: Pell Grant recipients achieved a six-year graduation rate of 61%. Stafford Loan (non-Pell) recipients achieved 60%. Students receiving neither form of aid achieved 70%.
Table 2. Six-Year Graduation Rates for Freshmen Cohort 2018 by Sex, Race/Ethnicity, and Aid Received.
Note: 2018 represents Academic Year (AY) 2018–2019. Data source: 2024 IPEDS Graduation Rate Survey, provided by the Office of Institutional Research.
-
Goal 3: One-Year Retention Rate
Goal 3: One-Year Retention Rate
Institutional Goal: For students enrolling as degree-seeking undergraduates, the College's strategic plan goal for the one-year retention rate is 87%. This goal reflects the College's commitment to first-to-second year retention of first-time, full-time freshmen as a foundational measure of student success.
The College of Charleston defines this measure as the percentage of first-time, full-time, degree-seeking freshmen who return to the institution one year after initial enrollment.
Outcome: Because retention is an essential element of the strategic plan, additional institutional effort and attention has been directed to this measure. Over the past ten years, the one-year freshmen retention rate has remained steady, ranging between 78.1% and 83.4% (Figure 1). The most recent cohort (entering Fall 2024) returned at a rate of 81.7%. Compared with other South Carolina institutions, the College of Charleston ranks fourth among the twelve institutions in the four-year college and university category — following Clemson, USC Columbia, and the Citadel (Figure 2).
Figure 1. One-Year Freshmen Retention Rates, College of Charleston.
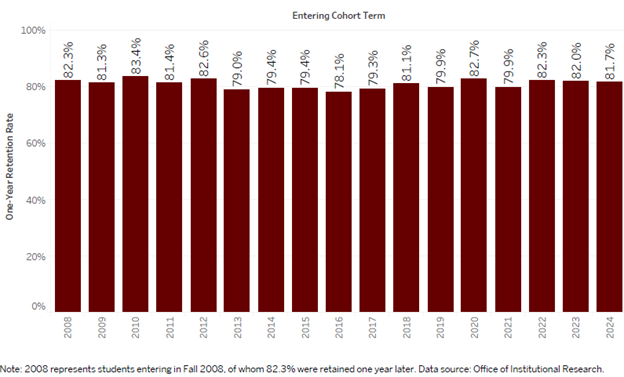
Note: Each year represents students entering in that Fall term, of whom the indicated percentage were retained one year later. Data source: Office of Institutional Research.
Figure 2. One-Year Freshmen Retention Rates for Freshmen Entering 2023, South Carolina Four-Year Colleges and Universities.
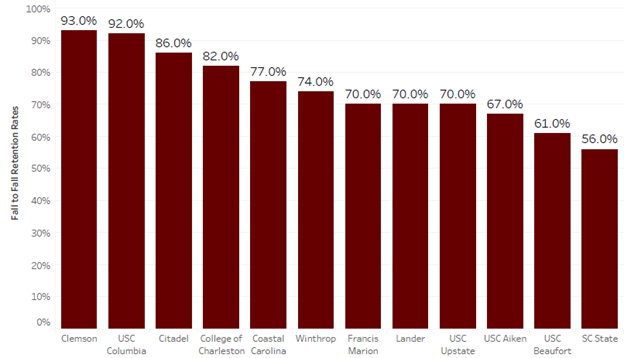
Data source: Office of Institutional Research.
-
Goal 4: Graduate Course Completion Rate
Goal 4: Graduate Course Completion Rate
Institutional Goal: The College of Charleston's institutional indicator for graduate student achievement is the graduate FW (Fail/Withdrawal) rate, with a goal of 3% or below of graduate course enrollments in an academic year. Because a grade of C is the lowest acceptable grade for graduate students, the graduate measure excludes D grades.
The Graduate School of the University of Charleston, S.C. at the College of Charleston is an integral component of the institution's mission. As articulated in narrative 2.1, the College is committed to developing "ethically centered, intellectually versatile and globally fluent citizens who create innovative solutions to social, economic and environmental challenges." Although smaller in scale than the undergraduate program, the Graduate School advances this mission at the post-baccalaureate level and is central to the College's status as a doctoral/professional university under South Carolina Code of Laws Title 59, §59-103-15, which authorizes the institution to offer master's, professional, and a limited number of doctoral degrees.
Because course completion is foundational to timely degree completion, the College monitors the graduate FW rate as an institutional indicator of student achievement at the graduate level. This threshold is appropriate across a wide variety of graduate programs, all of which carry high expectations for student success and progression through master's and professional degree requirements.
Outcome: Over the nine most recent academic years (AY 2016–17 through AY 2024–25), the graduate FW rate has remained at or below the 3% goal in every reported year (Figure 1). The rate has ranged from a low of 1.4% in AY 2023–24 to a high of 3.0% in AY 2020–21. The most recent year, AY 2024–25, shows a graduate FW rate of 1.5%, well below the goal. Across the nine-year reporting period, the graduate FW rate has averaged approximately 2.2%. In nearly every year, the share of graduate students withdrawing from a course exceeds the share failing a course, suggesting that withdrawal — rather than academic failure — is the primary driver of non-completion at the graduate level.
The consistently low FW rate reflects the maturity of graduate program advising and the close faculty mentoring relationships that characterize the College's master's and professional programs. This outcome demonstrates institutional progress toward the mission's commitment to producing intellectually versatile graduates prepared to address complex social, economic, and environmental challenges.
Figure 1. College of Charleston Graduate School FW Rates: AY 2016–2017 to AY 2024–2025.
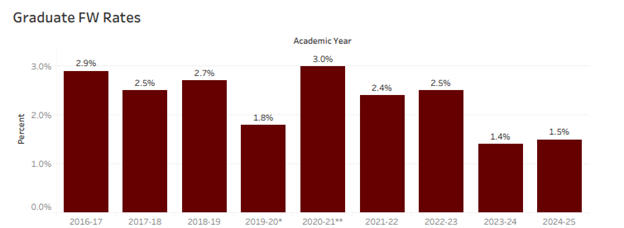
Note 1: Grades given where quality hours do not contribute to a student's GPA are excluded from this report.
Note 2: Due to the COVID-19 global pandemic, a new grade type was created in Spring 2020 to reflect the significant disruption students and faculty experienced. The significant disruption grade type included two values: PS (passing grade C and above; credit earned without impact on the GPA) and NS (failing; no credit earned, no impact on the GPA). As a result, the FW rate is not comparable to other semesters in which only the standard letter grades A–F were allowed and the W deadline appearing on the academic calendar was enforced. Consequently, Spring 2020 FW data is excluded from the above chart.
Data source: Office of Institutional Research.